Chief Justice John Roberts wanted more harmony at the Court. At his confirmation hearings, he decried the division that prevails among the Justices in rendering decisions. Too much disagreement. Not enough speaking with one voice.
It has now been 4 years. Roberts assumed the helm of the Court in 2005, a few days short of the first Monday in October. Just in the nick of time to preside over the entire 2005-2006 term. That term and 3 others have now passed with Roberts in the center seat. So how is he doing?
At the least, how successful has the Chief Justice been in reducing the division at the Court? At getting the Justices to come together, to agree on resolving the difficult and, yes, divisive issues that confront the Court? Well....
Let's take a look at the number of divided decisions, the ones with a dissenting opinion, for each year--each term of Court--since Robert's took over as the Chief.
GRAPH 1
Decisions With Dissent Under Roberts
OCT05 thru OCT08 Terms
(click to enlarge)
 As Graph 1 makes clear, divided decisions have been steadily rising through the four terms of the Roberts Court. For the October 2005 term (i.e., Fall 2005 - Spring 2006), Roberts's first year as Chief Justice, decisions with dissent numbered only 41. For the October 2008 term, the fourth and most recently completed term, the number had climbed to a high 61.
Divided decisions in Chief Justice Roberts's first term were "only 41" only in the sense of being lower than any of the three years that followed, and being somewhat lower than the number in any of the four previous terms under Roberts's predecessor, William Rehnquist. And divided decisions in Roberts's fourth (last) term were "a high 61" in the sense not only of being the highest in his four terms, but also higher than in any of the previous four terms under Rehnquist.
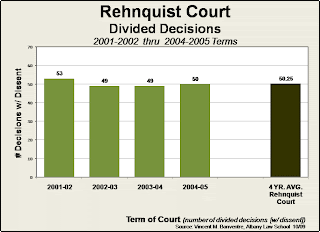
Let's take a look at those previous four terms under William Rehnquist--last four years of the Rehnquist Court, 2001-02 through 2004-05.
GRAPH 2
Decisions With Dissent Under Rehnquist
OCT01 thru OCT04 Terms
(click to enlarge)
 (Does anyone appreciate the cactus green--used for the Rehnquist years in honor of the late Chief's beloved home state of Arizona? I, at least, kind of liked that.)
As shown in Graph 2, decisions with dissent hovered around 50 throughout Chief Justice Rehnquist's last four terms. They never went as low as the 41 in Robert's first term. But neither did they reach as high as 61 as they did in Roberts's last.
Indeed, divided decisions seem to have levelled off at around 50 in the Rehnquist Court. There has been, as yet, no such apparent levelling under Chief Justice Roberts.
Let's merge these first two graphs for a closer visual comparison.
GRAPH 3
Rehnquist Ct. vs. Roberts Ct.
Decisions With Dissent
(click to enlarge)
 (I hope someone also appreciates this multicolored graph. It took me almost as much time to figure out how to do this and put it together as it did to do the research it represents!)
Graph 3 reflects virtually everything previously discussed. A couple of extra points are made clear as well. First, the averages for the Rehnquist and Roberts Courts are virtually the same. In fact, the average is slightly higher for the first four terms with Roberts as Chief than for the last four terms with Rehnquist.
But much more significantly, the second point, is that divided decisions have not declined under Chief Justice Roberts. Despite his expressed preference and intent at the confirmation hearings, he has not been successful in reducing division--except perhaps for a brief honeymoon period in his first term.
None of this is to blame Roberts or attribute any responsibility to him. Considering the difficult, controversial, policy and ideology laden issues that come before the Court for resolution, it would be rather surprising--no, astonishing--if there were a high degree of unanimity.
Affirmative action, abortion, church and state separation, presidential war powers, campaign finance, gun rights, rights of the accused, the death penalty, gay and same-sex rights, government taking of private property, federal power versus states rights, etc., etc., etc. Take any nine intelligent, informed, concerned humans and ask them to resolve these issues. How much unanimity would you expect?
If one believes that the work of judicial decision-making is akin to finding the best dictionary definition of words in legal texts--which, admittedly, the most naive and self-deluding judges and politicians do seem to think--then frequent unanimity might be expected. But even a slightly more honest and mature understanding of the judicial process would make it pretty obvious that unanimity, like certainty, would be the exception not the rule.
Yes, historically, there have been times when unanimity reigned. In the early years of the Republic, the great Chief Justice John Marshall exerted such command over his colleagues that he was usually able to secure unanimous rulings. And this despite the controversial and far-reaching nature of his Court's decisions--most of which he himself authored.
Indeed, Marshall's seemingly iron control over the Court infuriated Thomas Jefferson who complained about it to his own appointee, William Johnson. In reply to a letter from Jefferson, Johnson explained that his colleagues on the Court were simply unwilling and incapable of challenging Marshall. As he wrote:
"Cushing was incompetent, Chase could not be got to think or write—Patterson was a slow man and willingly declined the trouble, and the other two judges you know are commonly estimated as one judge.” Letter from William Johnson to Thomas Jefferson (Dec. 10, 1822)Another historic example of unanimity, albeit in one case, was the Court's decision ending racial segregation in Brown v. Board of Education. In that 1954 ruling, the new Chief Justice, Earl Warren, was able to secure the assent of all his colleagues, despite the serious reservations and resistance of some of them. And despite the urgings of law clerk William Rehnquist who tried to persuade the Justice for whom he worked, Robert Jackson, to vote to retain the "separate but equal" doctrine.
As Rehnquist wrote in his memo to Justice Jackson, complaining that ending segregation would be injecting the Justices' "own sociological views into the Constitution":
"I realize that it is an unpopular and unhumanitarian position, for which I have been excoriated by 'liberal' colleagues but I think that Plessy v. Ferguson [the 1896 decision upholding racial segregation and approving "separate but equal treatment" of the races] was right and should be affirmed." As quoted in John W. Dean, THE REHNQUIST CHOICE (2001).Fortunately, the "liberals" on the Court succeeded in illicitly forcing their own idiosyncratic "sociological views" upon the country. The Court condemned racial segregation as a violation of the Constitution's promise of equal protection of the law. Justice Jackson, of course, agreed with the Court's decision and, as already noted, Chief Justice Warren was ultimately able to secure a unanimous vote.
But such unanimity is not typical in the tough decisions made by the Court. And Chief Justice Roberts has not been able to reduce what is typical, the decisions with dissent. As a final visualization of the continued division at the Court, let's conclude this post with one last comparison of divided decisions under Rehnquist and Roberts.
GRAPH 4
Rehnquist Ct. vs. Roberts Ct.
Decisions With Dissent--4 Year Totals
(click to enlarge)
 As depicted in Graph 4, the total number of decisions with dissent was slightly higher in the first four terms since Roberts became Chief than it was for the last four terms under Rehnquist. To be sure, the increase is entirely insignificant.
But again, what is significant is that there has been no decrease of division at the Court. This, despite Roberts's stated aspiration and, one would thus assume, his efforts.
(Note: In determining the number of decisions with dissent, I have included all the decisions rendered by the Court in which there has been a dissenting opinion. These include decisions on the merits as well as other, more summary decisions. For example, some of the Court's decisions on petitions for certiorari have generated dissenting opinions. These have been included in my tabulations. Figures that might be used elsewhere, by myself or others, that count only decisions with full opinions on the merits, are usually somewhat different.)


